@turingspark/mcp-debug
A CLI proxy that sits between your MCP client and server, logging every JSON-RPC message in both directions with timing information. Works with any MCP server — no code changes required.
What mcp-debug does
When an MCP tool returns unexpected output, fails silently, or takes longer than expected, mcp-debug shows you the exact bytes on the wire so you can diagnose the problem without guessing.
Full message log
Every request and response logged — initialize handshake, tool calls, notifications.
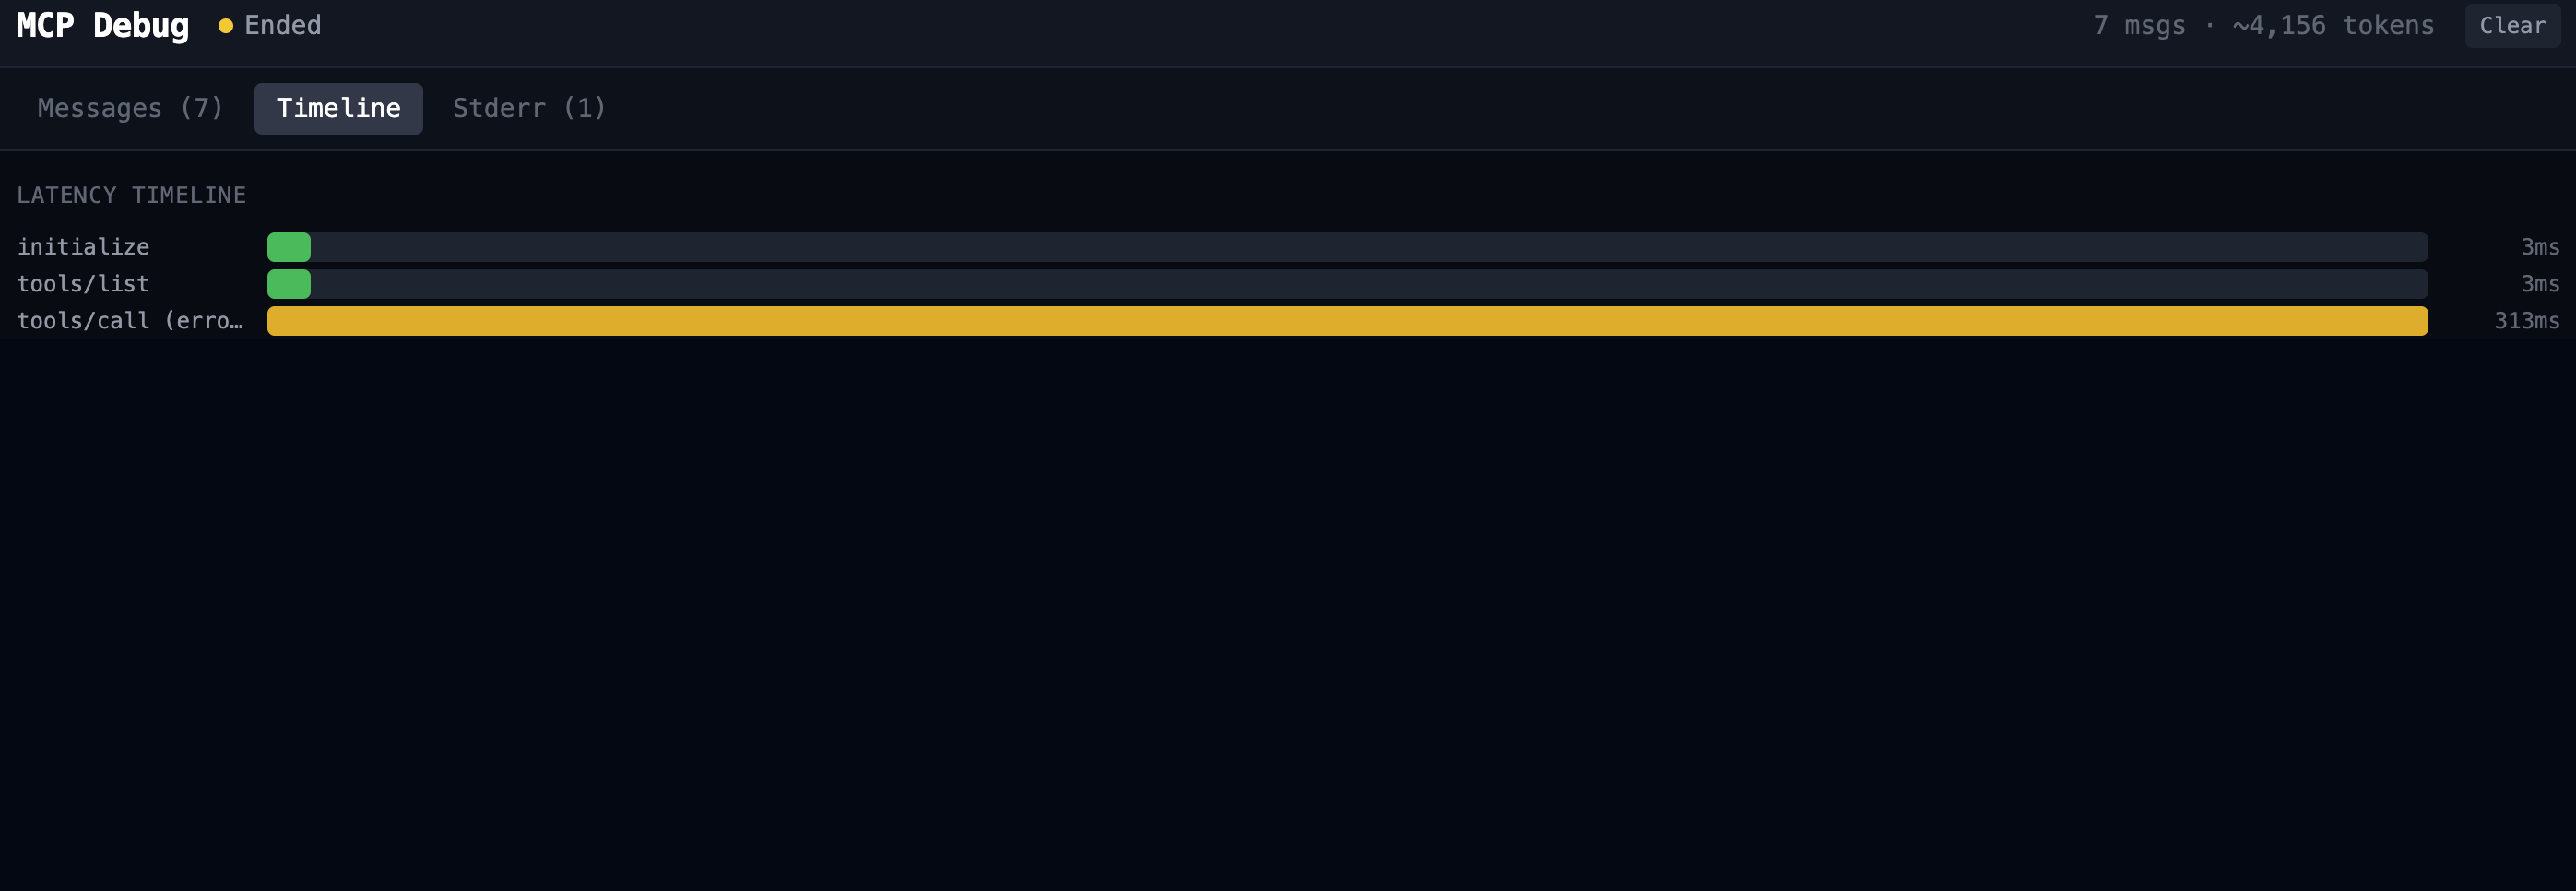
Per-call latency
Response time shown on every call. Spot slow tools immediately.
Error flagging
Protocol errors and tool-level errors surfaced with an ERROR label automatically.
Web dashboard
Visual log browser at localhost:8100. Browse sessions and inspect payloads.
Quick Start
Install globally or run with npx — no config required.
CLI flags
| Flag | Description |
|---|---|
| --verbose | Log full JSON payloads for every message |
| --port <n> | Dashboard port (default: 8100) |
| -- <cmd> [args] | Server command and args — canonical form, handles paths with spaces |
| --cmd "<cmd>" | Alternative for simple commands without spaces in paths |
Output legend
| → | Request sent from debug proxy to server |
| ← | Response received from server |
| ERROR | Response contains a JSON-RPC error object or isError: true |
| [Nms] | Latency for that call in milliseconds |
Examples
Three real scenarios showing what you see on the wire.
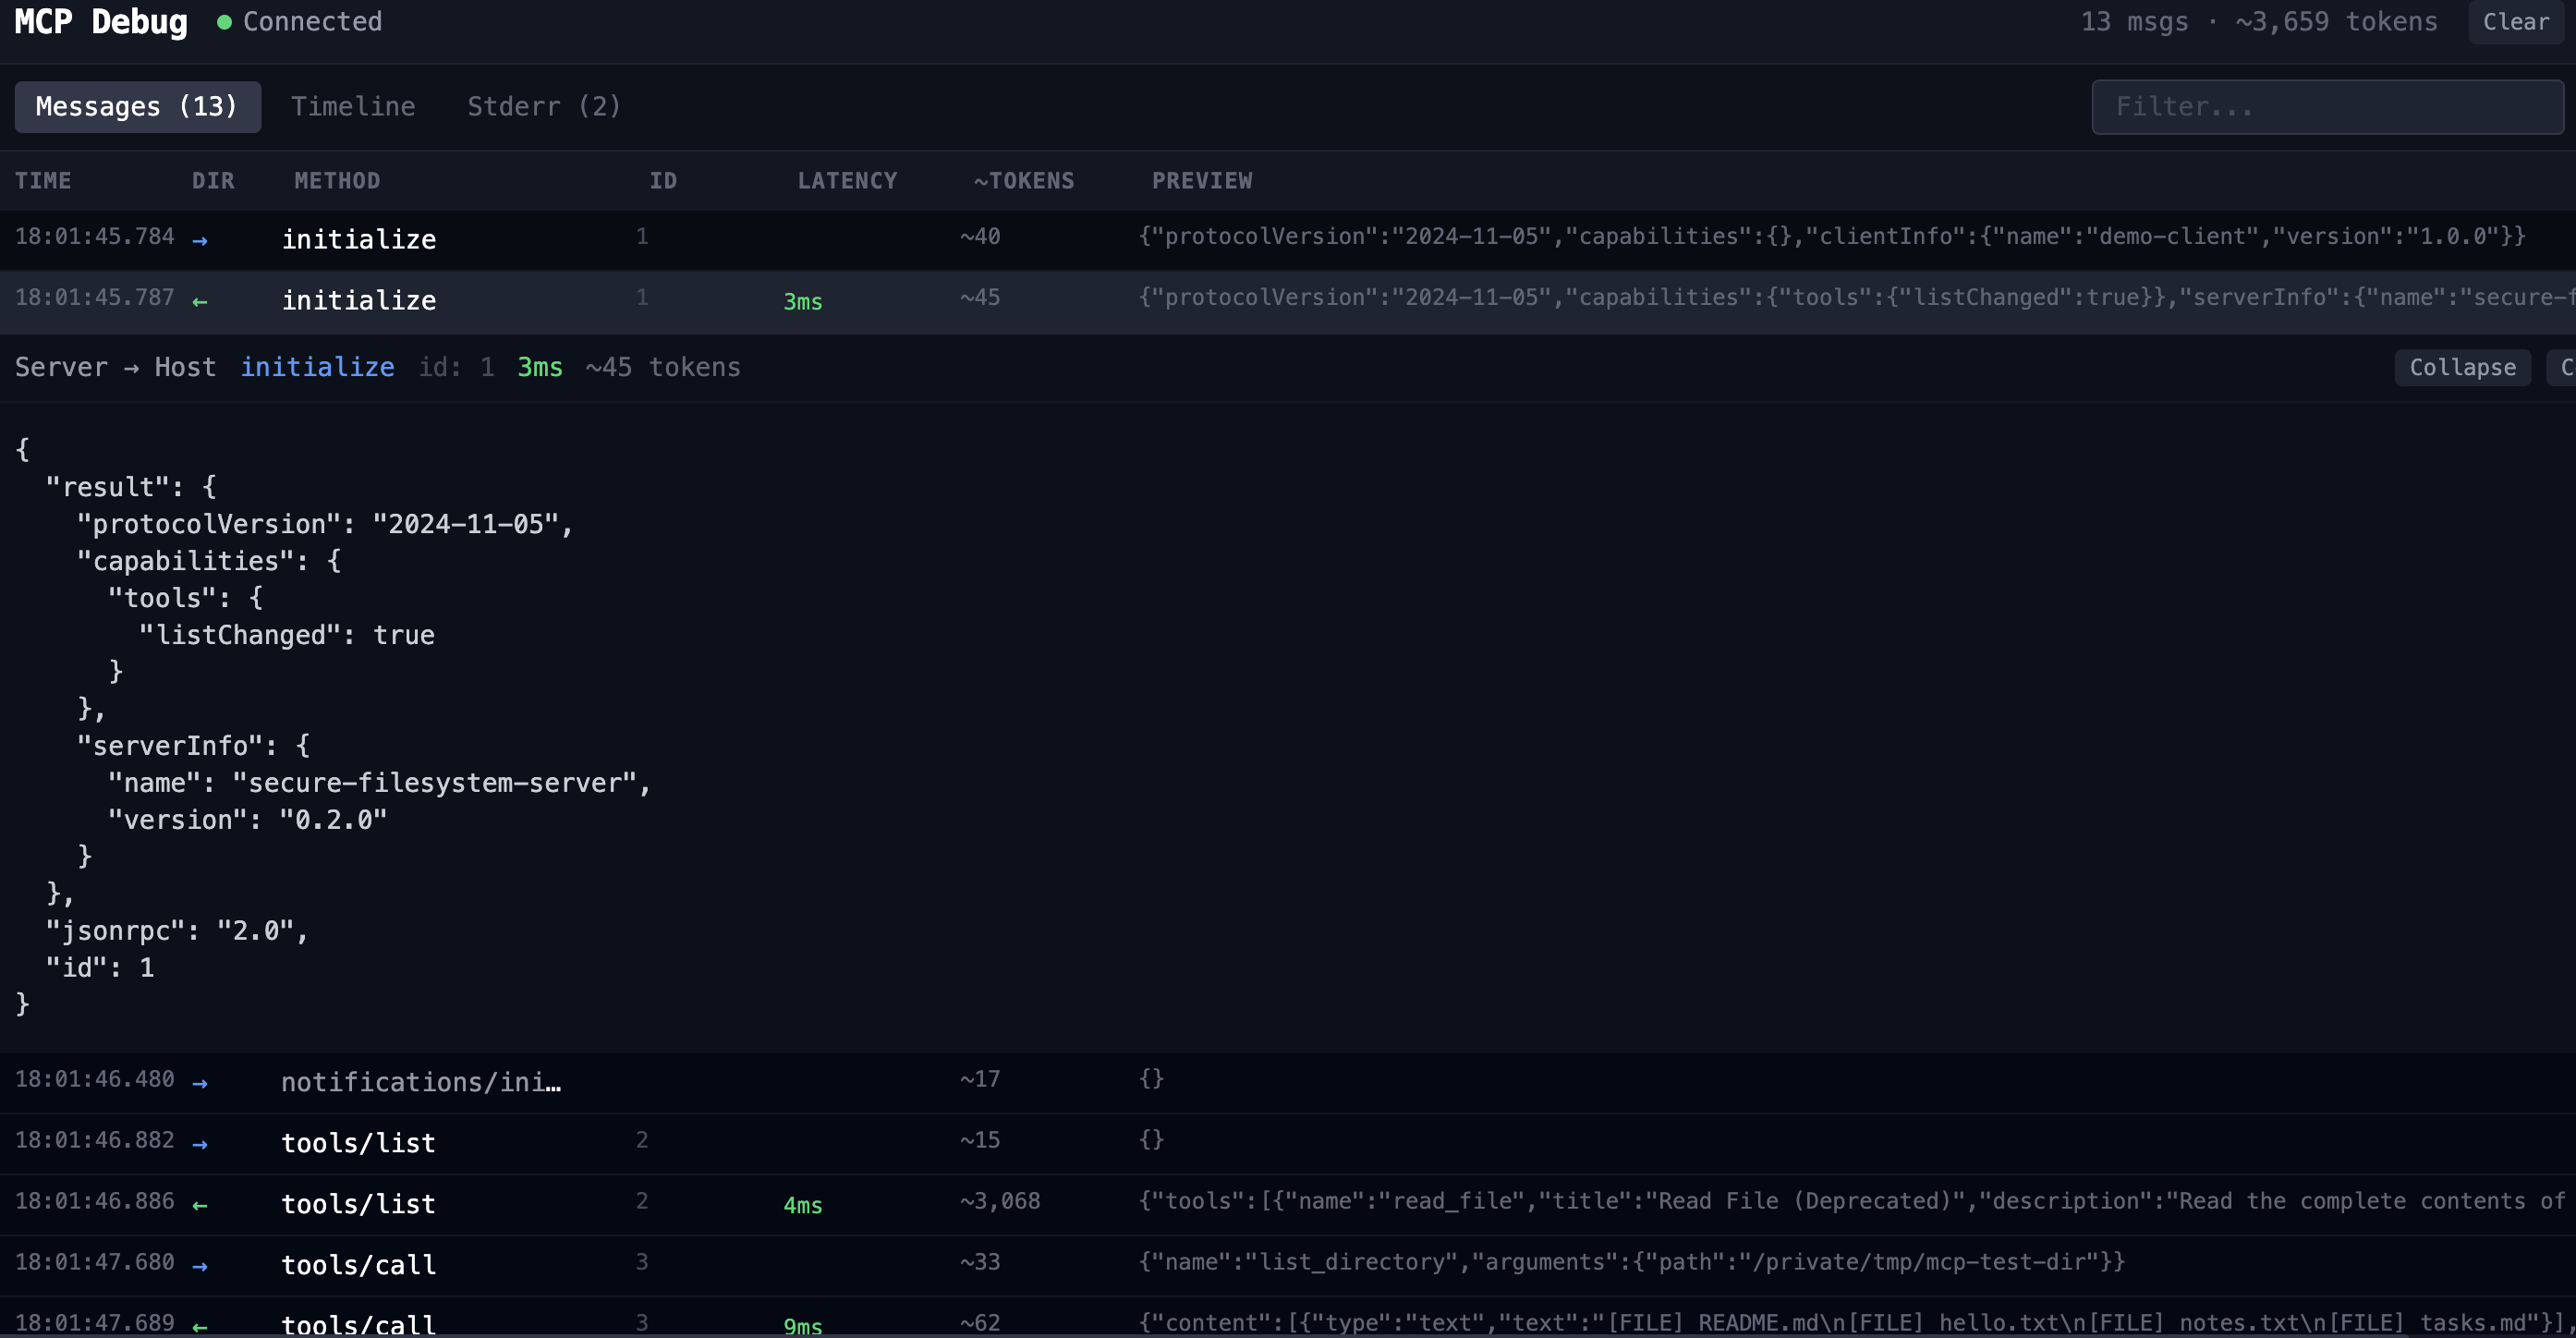
Listing a directory
The simplest way to see mcp-debug in action. Uses mcp-server-filesystem to list a local directory — one tool call, a clean response, and the full initialize handshake visible from the start.
[mcp-debug] Proxying: mcp-server-filesystem /tmp/mcp-test-dir
[mcp-debug] Dashboard: http://localhost:8100
[mcp-debug] Session: session_1774190205017_gpgq4n
-> initialize id=1
{ "method": "initialize", "params": { ... } }
<- initialize id=1 [105ms]
{ "result": { "serverInfo": { "name": "secure-filesystem-server" } } }
-> tools/call id=2
{ "params": { "name": "list_directory", "arguments": { "path": "..." } } }
<- tools/call id=2 [4ms]
{ "result": { "content": [{ "text": "[FILE] README.md [FILE] hello.txt" }] } }
Web UI — same session
Listing then reading a file
Most real workflows involve multiple tool calls in sequence. mcp-debug logs both calls with their own IDs and latencies, keeping the full conversation traceable.
-> tools/call id=2
{ "params": { "name": "list_directory" } }
<- tools/call id=2 [3ms]
{ "result": { "content": [{ "text": "[FILE] README.md ..." }] } }
-> tools/call id=3
{ "params": { "name": "read_file", "arguments": { "path": ".../README.md" } } }
<- tools/call id=3 [3ms]
{ "result": { "content": [{ "text": "# README " }] } }
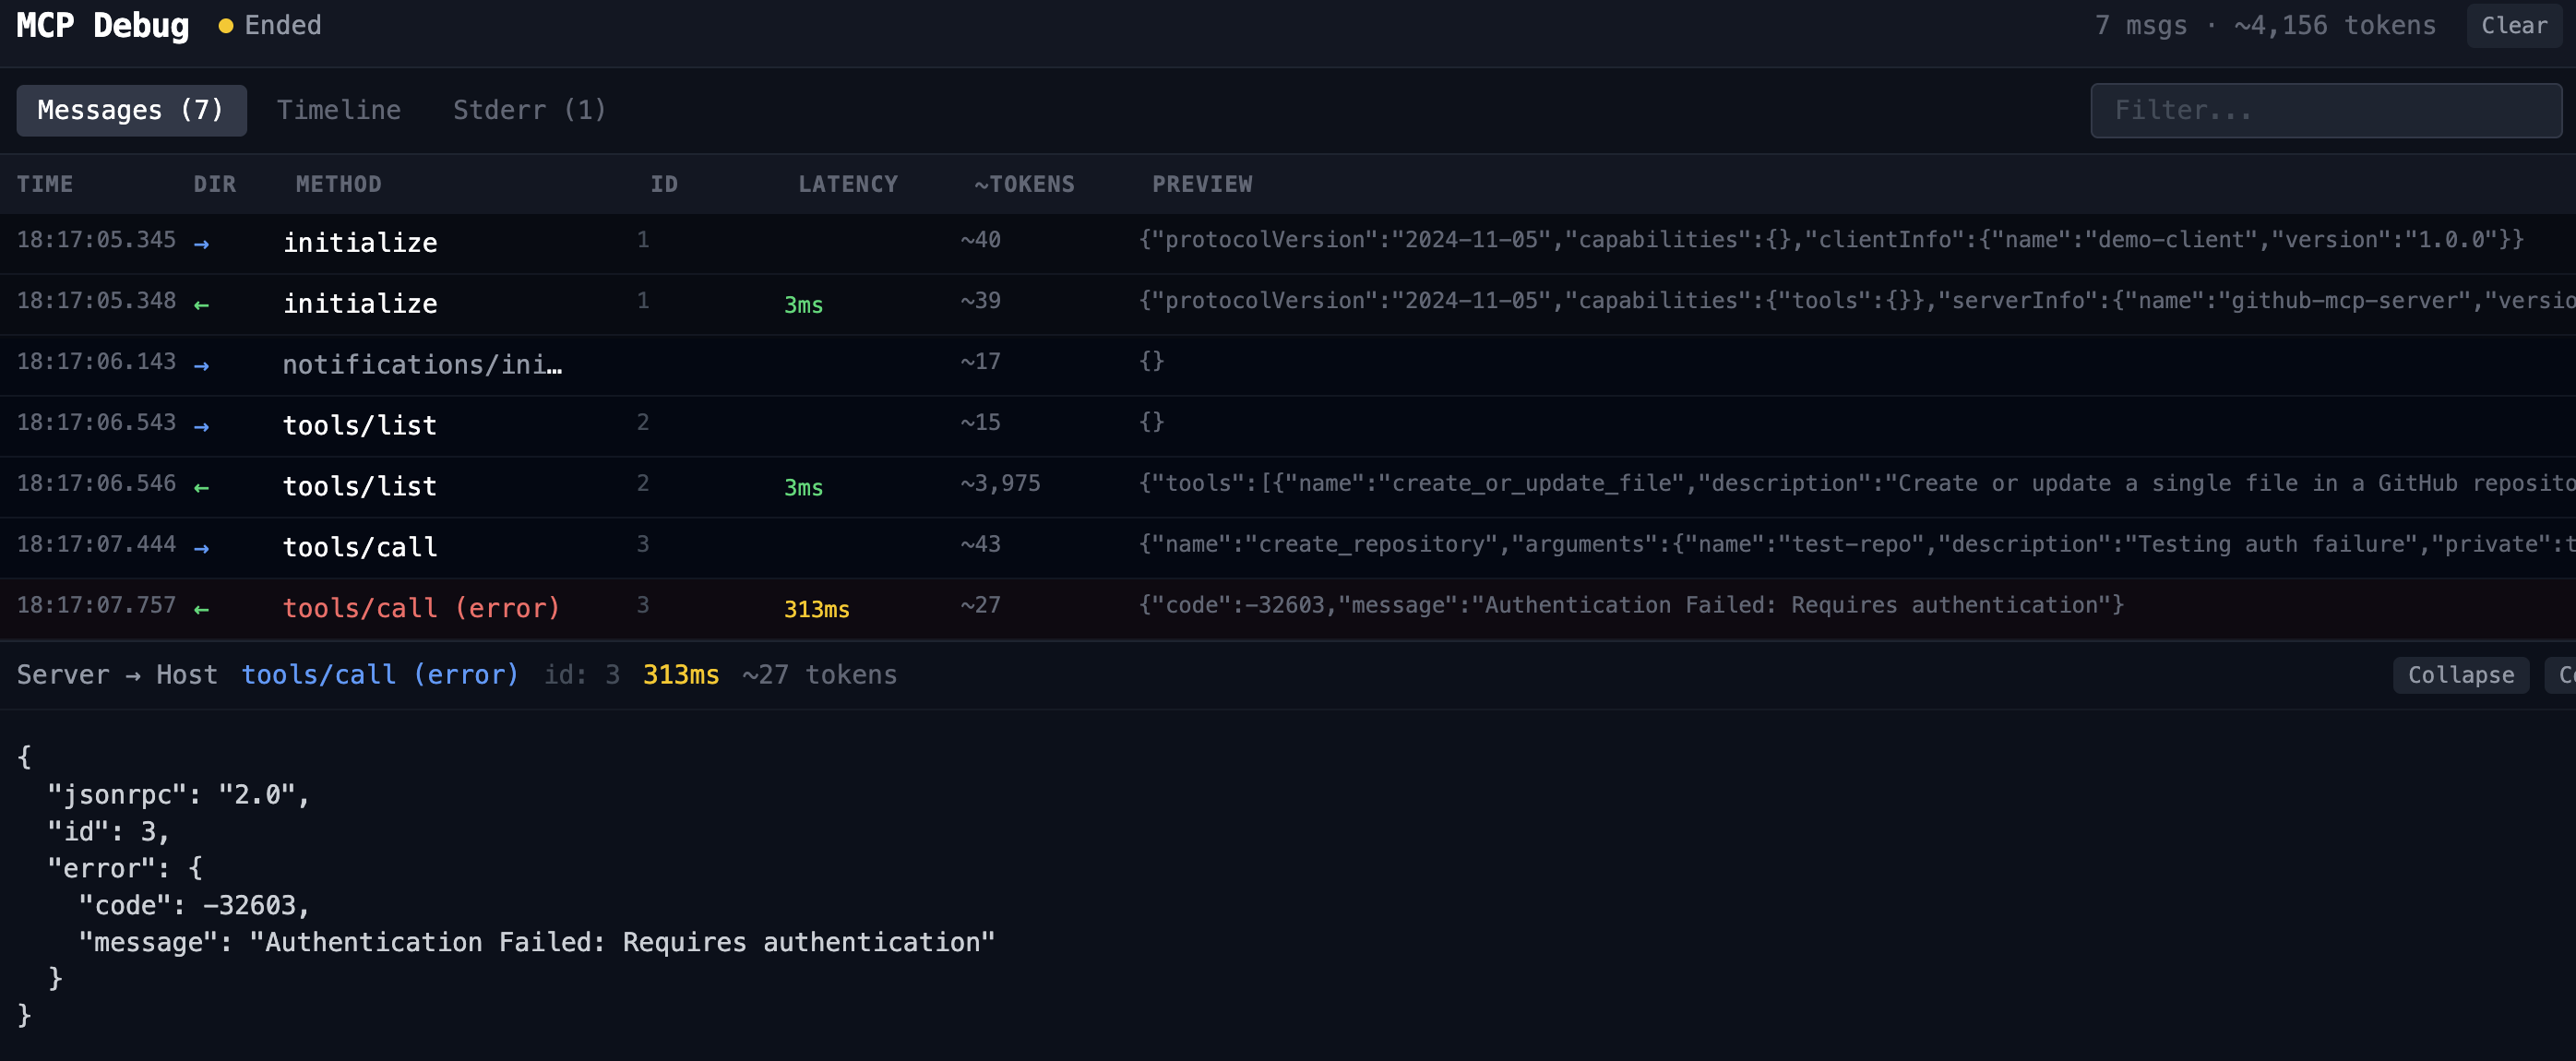
Catching an auth failure
When a server rejects a request, the error is often swallowed by the client and surfaces as a vague failure. mcp-debug shows the full JSON-RPC error envelope so you can see exactly what the server returned.
-> tools/call id=2
{ "params": { "name": "create_repository", ... } }
<- tools/call (error) id=2 [210ms] ERROR
{
"error": {
"code": -32603,
"message": "Authentication Failed: Requires authentication"
}
}
Web UI — same session
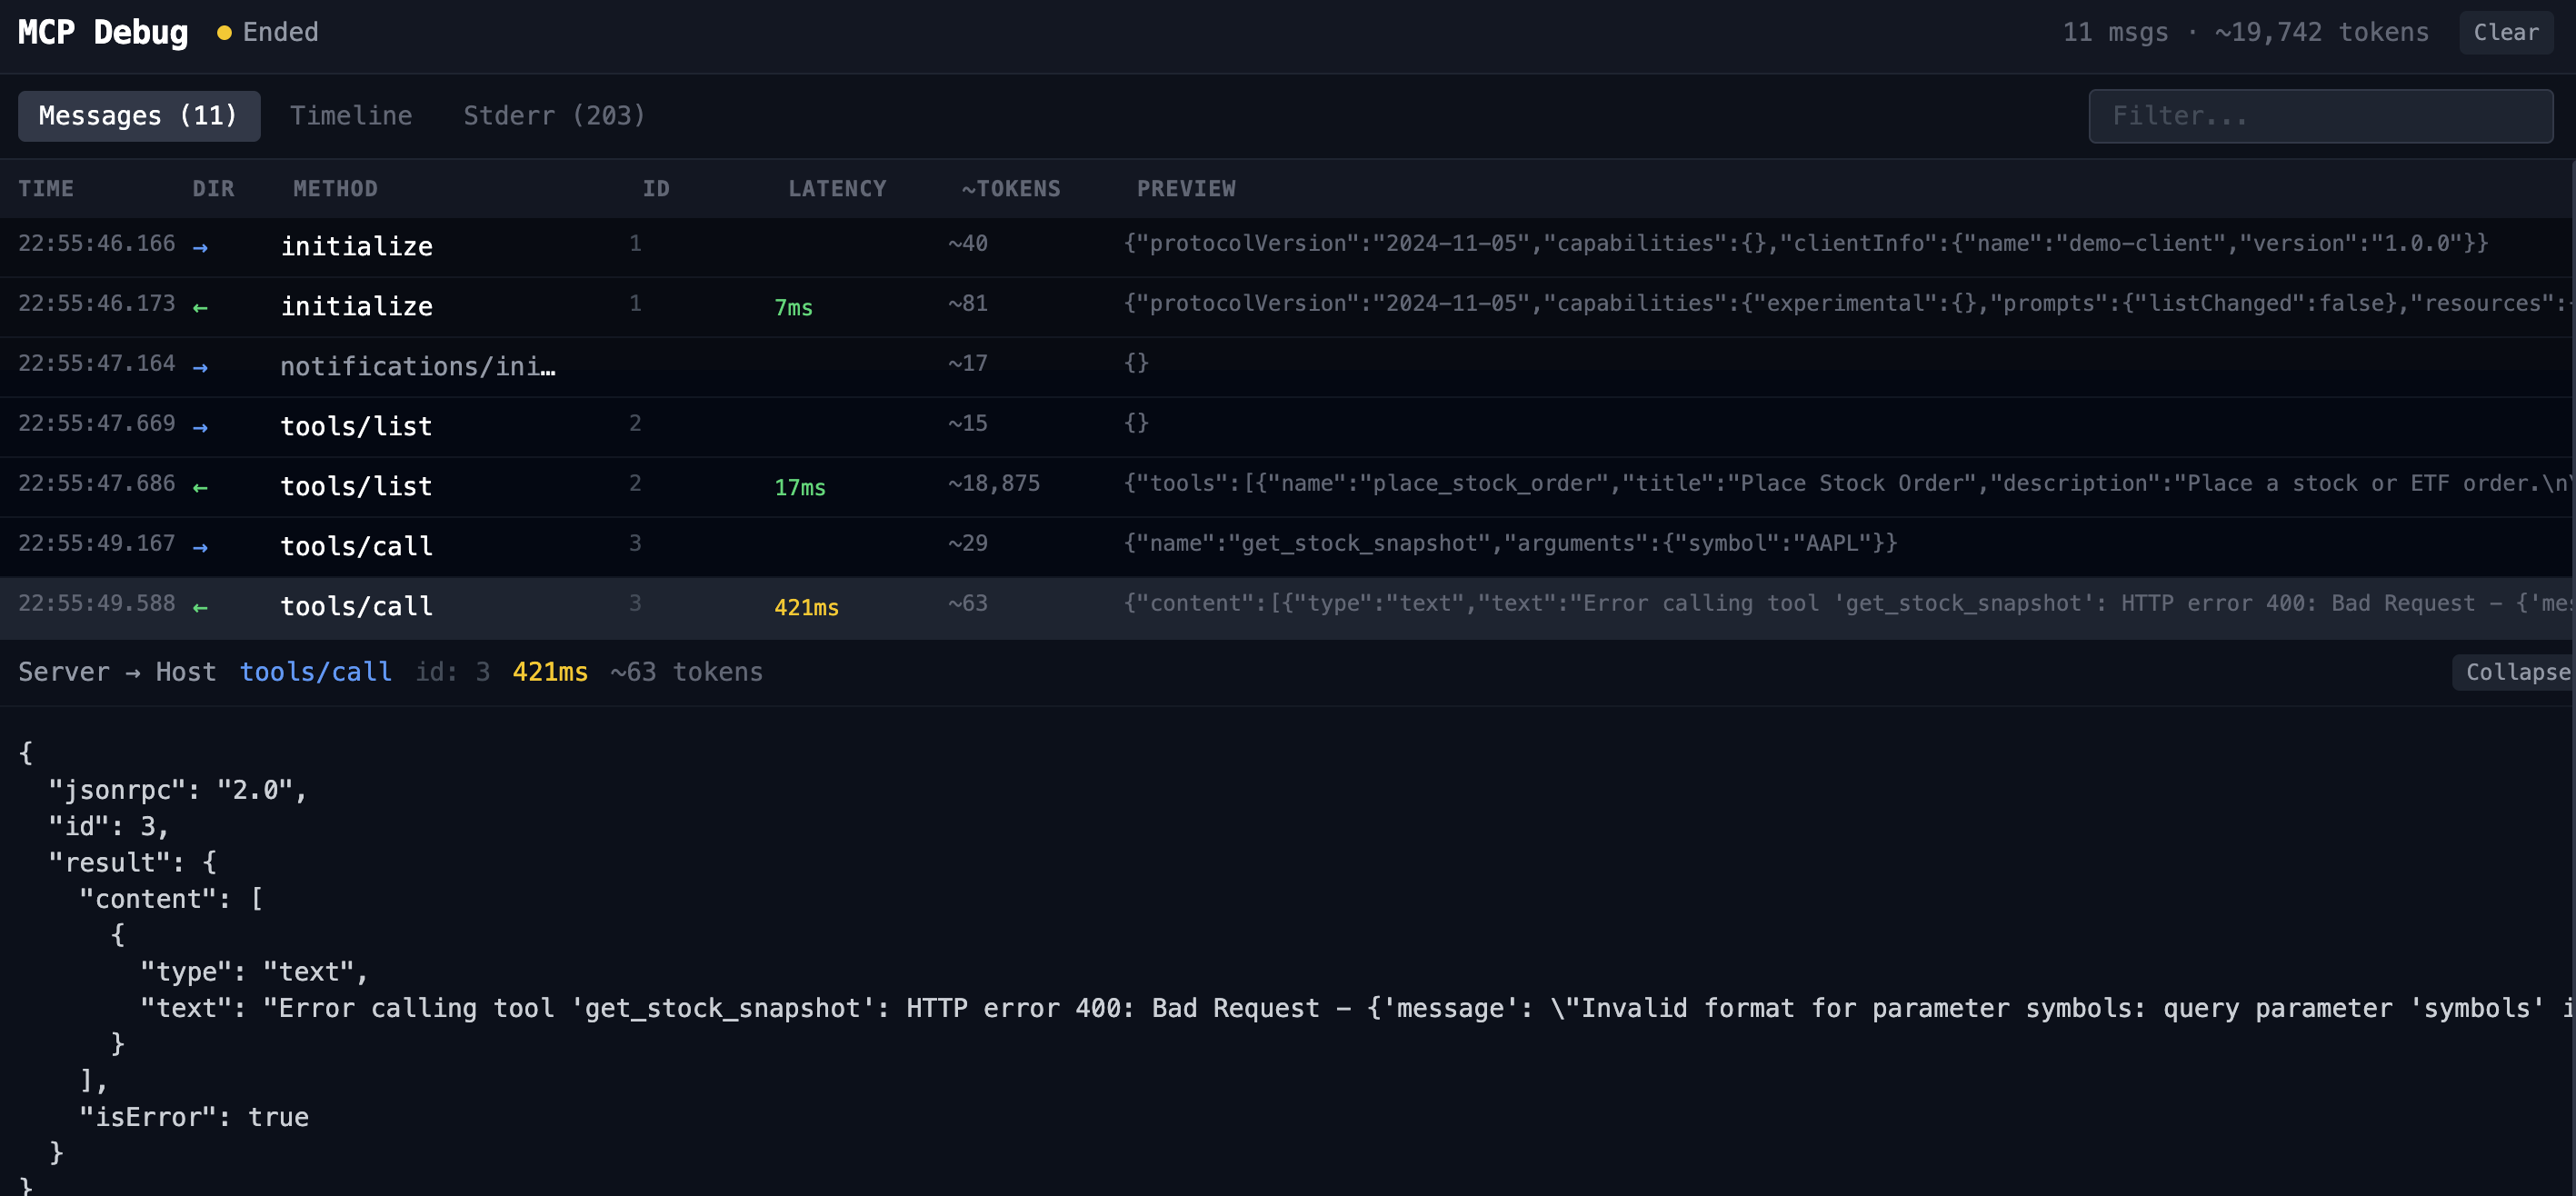
Debugging a wrong parameter name
When an MCP server wraps a third-party API, the parameter names it exposes don't always match what you'd expect. mcp-debug shows the exact error the server returns so you can fix the call immediately.
-> tools/call id=3 ~29 tokens
{
"params": {
"name": "get_stock_snapshot",
"arguments": { "symbol": "AAPL" }
}
}
<- tools/call id=3 [421ms] ~63 tokens ERROR
{
"result": {
"content": [{
"type": "text",
"text": "Error calling tool 'get_stock_snapshot': HTTP error 400:
Bad Request - {'message': "Invalid format for parameter
symbols: query parameter 'symbols' is required"}
}],
"isError": true
}
}
symbols, not symbol. The Alpaca API returns a 400 with the exact field name it expects — but only if you can see the raw JSON-RPC response. Without mcp-debug, your client would just show a generic tool failure.Web UI — same session
Claude Desktop Config
The -- separator form maps naturally to Claude Desktop's args array. Use this pattern to wrap any existing MCP server with mcp-debug for a debugging session:
Stop guessing. Start seeing.
Add mcp-debug to any MCP workflow and get full visibility into every message in seconds.
npx @turingspark/mcp-debug -- <your-server>